Abstract
Several endemic tropical diseases retard economic progress by devastating childhood development and also by reducing productivity in adults, especially among agricultural workers. One of these diseases – malaria – a major cause of death and disability – has been under attack on a large scale in Africa since 2005. This attack has been accompanied by remarkable increases in economic productivity. Following annual expenditures of about $0.2 billion for suppressing malaria, the mean per capita Gross Domestic Product of 14 African countries increased 98% after 7 years of intervention, while it improved only 66% in 9 comparable but untreated countries. The observed increase was significantly above previous estimates for the economic impact of malaria suppression. Without correcting for population changes, the increase could be viewed as a huge return of $133 billion in economic growth on an expenditure for malaria suppression of only $1.4 billion in these 14 countries, a ratio of almost 100:1. Unfortunately there is a serious risk that the success of current malaria suppression methods – based on a narrowly conceived strategy using only bednets, biocides and drugs – will soon collapse, due to development of resistance by the mosquitoes and the malaria parasites. To reduce this risk, a more durable strategy should be developed. The current slippage in funding for malaria programs from outside donors suggests an opportunity for African countries to increase their contributions, which would also give them more control over their national strategies. Suppression of malaria in Africa is a very sound investment; it should be continued.
Increased economic productivity after suppressing malaria transmission in 14 African countries
Malaria, a lethal disease transmitted in Africa by many species of mosquitoes, is expensive to suppress and quick to return if the suppression effort is discontinued (Jobin 2010, pp18-19). However, the expense of maintaining continuous suppression of malaria in Africa has traditionally been justified by expected improvements in human survival and quality of life, by expected national savings in health care expenses, and by expected direct benefits to economic productivity (Orem et al 2012). Although it has been widely asserted that malaria infections in African workers reduce national economic productivity through increased absenteeism and through impairment of their efficiency while at work, it has been difficult to measure this effect. To test the assertion, we examined the relation of malaria and economic productivity in 14 African countries where malaria was being suppressed under a new international effort.
Review of Ecological Background
In her signature address given in 1996 as a Radcliffe Fellow, the ecologist Letitia E. Obeng pointed out the difficulties in suppressing malaria and other parasitic diseases in Africa because they are ecologically embedded (Obeng 1997). Both the malaria mosquitoes and the external phase of the malaria parasite in the mosquitoes are protected by the climate in African countries which for most of the year is close to the temperature within the human body. Thus the parasite easily adapts to conditions in the mosquito phase, after developing in infected people. Obeng also pointed out that malaria mosquitoes originally evolved in the favorable humidity and temperatures found South of the Sahara Desert, making control of mosquitoes – and thus malaria – an almost intractable problem in the heart of Africa.
Obeng also identified an ecologic linkage between irrigated agriculture – an important component of economic growth in Africa – and expanded malaria transmission, through which irrigation and poor drainage increase the amount of water available to malaria mosquitoes for breeding. Others have demonstrated the importance of water management for suppressing malaria along the Senegal River in West Africa (Diop and Jobin 1986), and along the Blue Nile River in Sudan (Gaddal 1988). Because of these ecologic and economic linkages with irrigation and drainage, current research at MIT seeking engineering improvements to malarious irrigation systems in the Nile River Basin is evaluating operational and design techniques for reservoirs, irrigation canals, and drainage works, based on classical experience in the subtropical US (Jobin 2010, Sledge and Mohler 2013).
Review of Econometric Background
In the past, measuring the impact of malaria suppression on economic productivity has been difficult, not for lack of data on economic productivity, but because of the lack of data from a uniform program of malaria suppression. This changed dramatically with the advent of the US Presidential Malaria Initiative in 2005, which has resulted in continuing national programs of malaria suppression in 19 African countries (Fig. 1). This Malaria Initiative, also known as the PMI, is funded by the US Agency for International Development and is based on a uniform strategy for applying drugs, biocides and bednets, with an annual budget by 2012 of over half a billion US dollars (Somandjinga et al 2009, USAID PMI Annual Reports 2005-2013). Thus for the first time, a large number of African countries simultaneously experienced a marked decrease in transmission of malaria, over a period long enough to observe changes in their economic productivity.
Widespread economic data for Africa have been gathered regularly by the World Bank and other organizations for decades, but the availability of data on malaria suppression had been irregular in the past. Except for the short-lived Global Malaria Eradication Progam of the 1960’s, efforts at suppression of malaria in Africa were sporadic, as was the collection of data on malaria transmission. However since 2005, the Malaria Initiative has annually reported data for each protected country, especially costs and efforts expended. Unfortunately it has not directly measured changes in malaria transmission, but has reported general reductions in infant mortality in the treated countries. The Malaria Initiative now supports malaria suppression in parts of Asia and the Americas as well.
In analyzing the impact of suppressing malaria on economic productivity in Africa, the measure used to assess economic productivity is usually gross domestic product (GDP), expressed in terms of current US dollars, and also on a per capita basis. The accepted definition of GDP is the aggregate output of all goods and services in a country, including personal consumption, government expenditures, private investment, capital and net exports (World Bank GDP website).
Various approaches used in past econometric studies
Prior to the Malaria Initiative, investigators had to resort to complex mathematical extrapolations and computer simulations in their search for international patterns, because of wide variations in suppression efforts and the lack of uniform measurements of malaria transmission (Martin et al 2012, Purdy et al 2013). It was not until availability of the new set of national data for the 19 countries with the Malaria Initiative – combined with the wealth of data on national GDPs – that valid comparisons could finally be made on malaria suppression and economic productivity on a large number of African countries.
However in those previous attempts to assess the economic impact of malaria in Africa in which global comparisons were difficult, studies were conducted along three lines of enquiry. The first line of enquiry was to estimate the cost to the individual, their family, and government health services for each episode of malaria, multiplied by the number of episodes. The second line pursued was to estimate the reduction in work output by infected adults, multiplied by the number of infected adults, or conversely to estimate the increased economic productivity when the infection was eliminated. The third line of enquiry was to explore the long-term general relationship of poverty and malaria. The literature is reviewed below, following these three lines of enquiry.
Costs of disease episodes
Economic costs of malaria in children were estimated for three African countries (Sicuri et al 2013). These included average treatment costs per case of $12.00, $6.80 and $20.50 for Ghana, Tanzania and Kenya respectively. When health system prevention costs and lost economic productivity through early deaths were added, the total annual costs for these three countries were estimated at US$38 million, $132 million and $109 million, respectively.
An estimation of the costs of malaria to households and to the health system in Nigeria – based on questionnaires – indicated that household expenditures per case were $36, while costs to the health provider were $78 per case, with an annual non-recurrent cost to the provider of about $2,000 (Onwujekwe et al 2013). These costs were higher per case than those for Ghana, Tanzania and Kenya (Sicuri et al 2013), but were not summarized on an annual basis, nor were the losses in economic productivity estimated.
Changes in economic output
Using records for US civil war veterans, and extrapolating the data with the modern concept of “Disability Adjusted Life Years”, it was shown that malaria exposure in early life reduced ability to work in old age (Hong SC 2013).
It was estimated over a decade ago that tropical countries which had a 10% reduction in malaria prevalence were associated with 0.3% higher annual economic growth during the period 1965 to 1990, a small but positive relation (Gallup and Sachs 2001).
For Zambia it had been estimated in 2005 that an improved program for treatment of malaria infections would result in a 1.8% increase in the per capita GDP, based on a “Willingness to Pay” analysis (Masiye and Rehnberg 2005).
An argument supporting the value of suppressing malaria was made by focusing on the benefits to be derived from sustained anti-malaria efforts (Purdy et al 2013). By estimating the value of economic output from work-years saved among infected persons – while subtracting the costs of suppression – it was calculated that malaria suppression expenditures from 2013-2035 would result in a 2013 net present value of $209 billion over this 22 year period. These estimations were based on the assumption that the Global Malaria Action Plan of WHO would be fully funded.
Using another econometric model, it was estimated that malaria in Uganda resulted in an annual loss of 0.8% of their per capita GDP in 2003 (Orem et al 2012). While extrapolating from rather weak data, this study did indicate a positive relation between suppression of malaria and increased productivity.
Associations of poverty and malaria
A new economic model for malaria and poverty was proposed, based on survey data from Uganda which indicated that there is prevalence -elasticity in protective behavior regarding malaria (Berthelemy et al 2013). The authors proposed a “malaria trap” to explain this behavior, in which malaria reinforced poverty and poverty reduced the ability of people to deal with malaria risks. They thus concluded that the very poor must get special treatment in malaria suppression efforts.
A correlation was sought between malaria infections in children and socioeconomic status, based on a systematic review of the literature and meta-analysis (Tusting et al 2013). It was found that malaria infection was highest in the poorest children. However the authors did not recommend focusing on improving economic performance to the detriment of malaria suppression.
Selection of comparable countries
In order to find similar countries for comparing economic performance with and without malaria suppression, two groups of countries were selected on the basis of their similar malaria experience, similar geography, similar climate, similar recent political history, and similar levels of economic productivity. Of course the group designated as the “treated countries” had to begin with those 19 countries selected for support by the Malaria Initiative (Fig 1). According to reports of the Malaria Initiative, these countries were selected by simple criteria; primarily a high malaria disease burden.
These two similar groupings were necessary because of the high variability in economic productivity across Africa. An important source of variance in economic performance was the unusually high GDPs of some countries due to their ability to extract and export oil. For instance, because of its large oil fields, Angola had a calculated per capita GDP over $5,000 in 2012, ten times that of Tanzania which depended on subsistence agriculture, but which had few valuable exports (World Bank GDP website). The economics of oil exportation are largely dependent on the price of oil on the world market and thus independent of labor efficiency which might be affected by malaria. Clearly the GDP data for oil exporting countries required special treatment in a continental analysis.
In the past few years, many African countries have seen remarkable economic growth, after decades of stagnation. This has been most evident in West Africa where the recent end of civil wars and the establishment of stable democracies was followed by noticeable improvements, including strong economic growth. Thus it was important to select countries which had been safe from civil warfare for some time. Country selection was also based on similar characteristics regarding malaria experience, climate and geography.
Purpose
Our evaluation was aimed at determining the impact of malaria suppression on economic productivity, assuming that malaria directly impacts the labor force – especially in agricultural economies. To do this, we examined the economic impact of malaria suppression since the Malaria Initiative began in 2005, until 2012.
Careful evaluation of the Malaria Initiative is particularly important for two reasons. Firstly it has grown to be one of the largest programs of malaria suppression in the world. Secondly the control methods used in the suppression strategy are ephemeral and must thus be re-financed every year, requiring strong economic justification for its continuation. Because suppression of malaria by the current ephemeral methods must continue for decades, the economics of the effort might be as important as the epidemiology.
Approach
We took data from three sources: the Annual Reports of the Malaria Initiative (US Presidential Malaria Initiative 2005-2012), from data sources in the World Bank on Gross Domestic Products (World Bank GDP website), and from population reports (Index Mundi website).
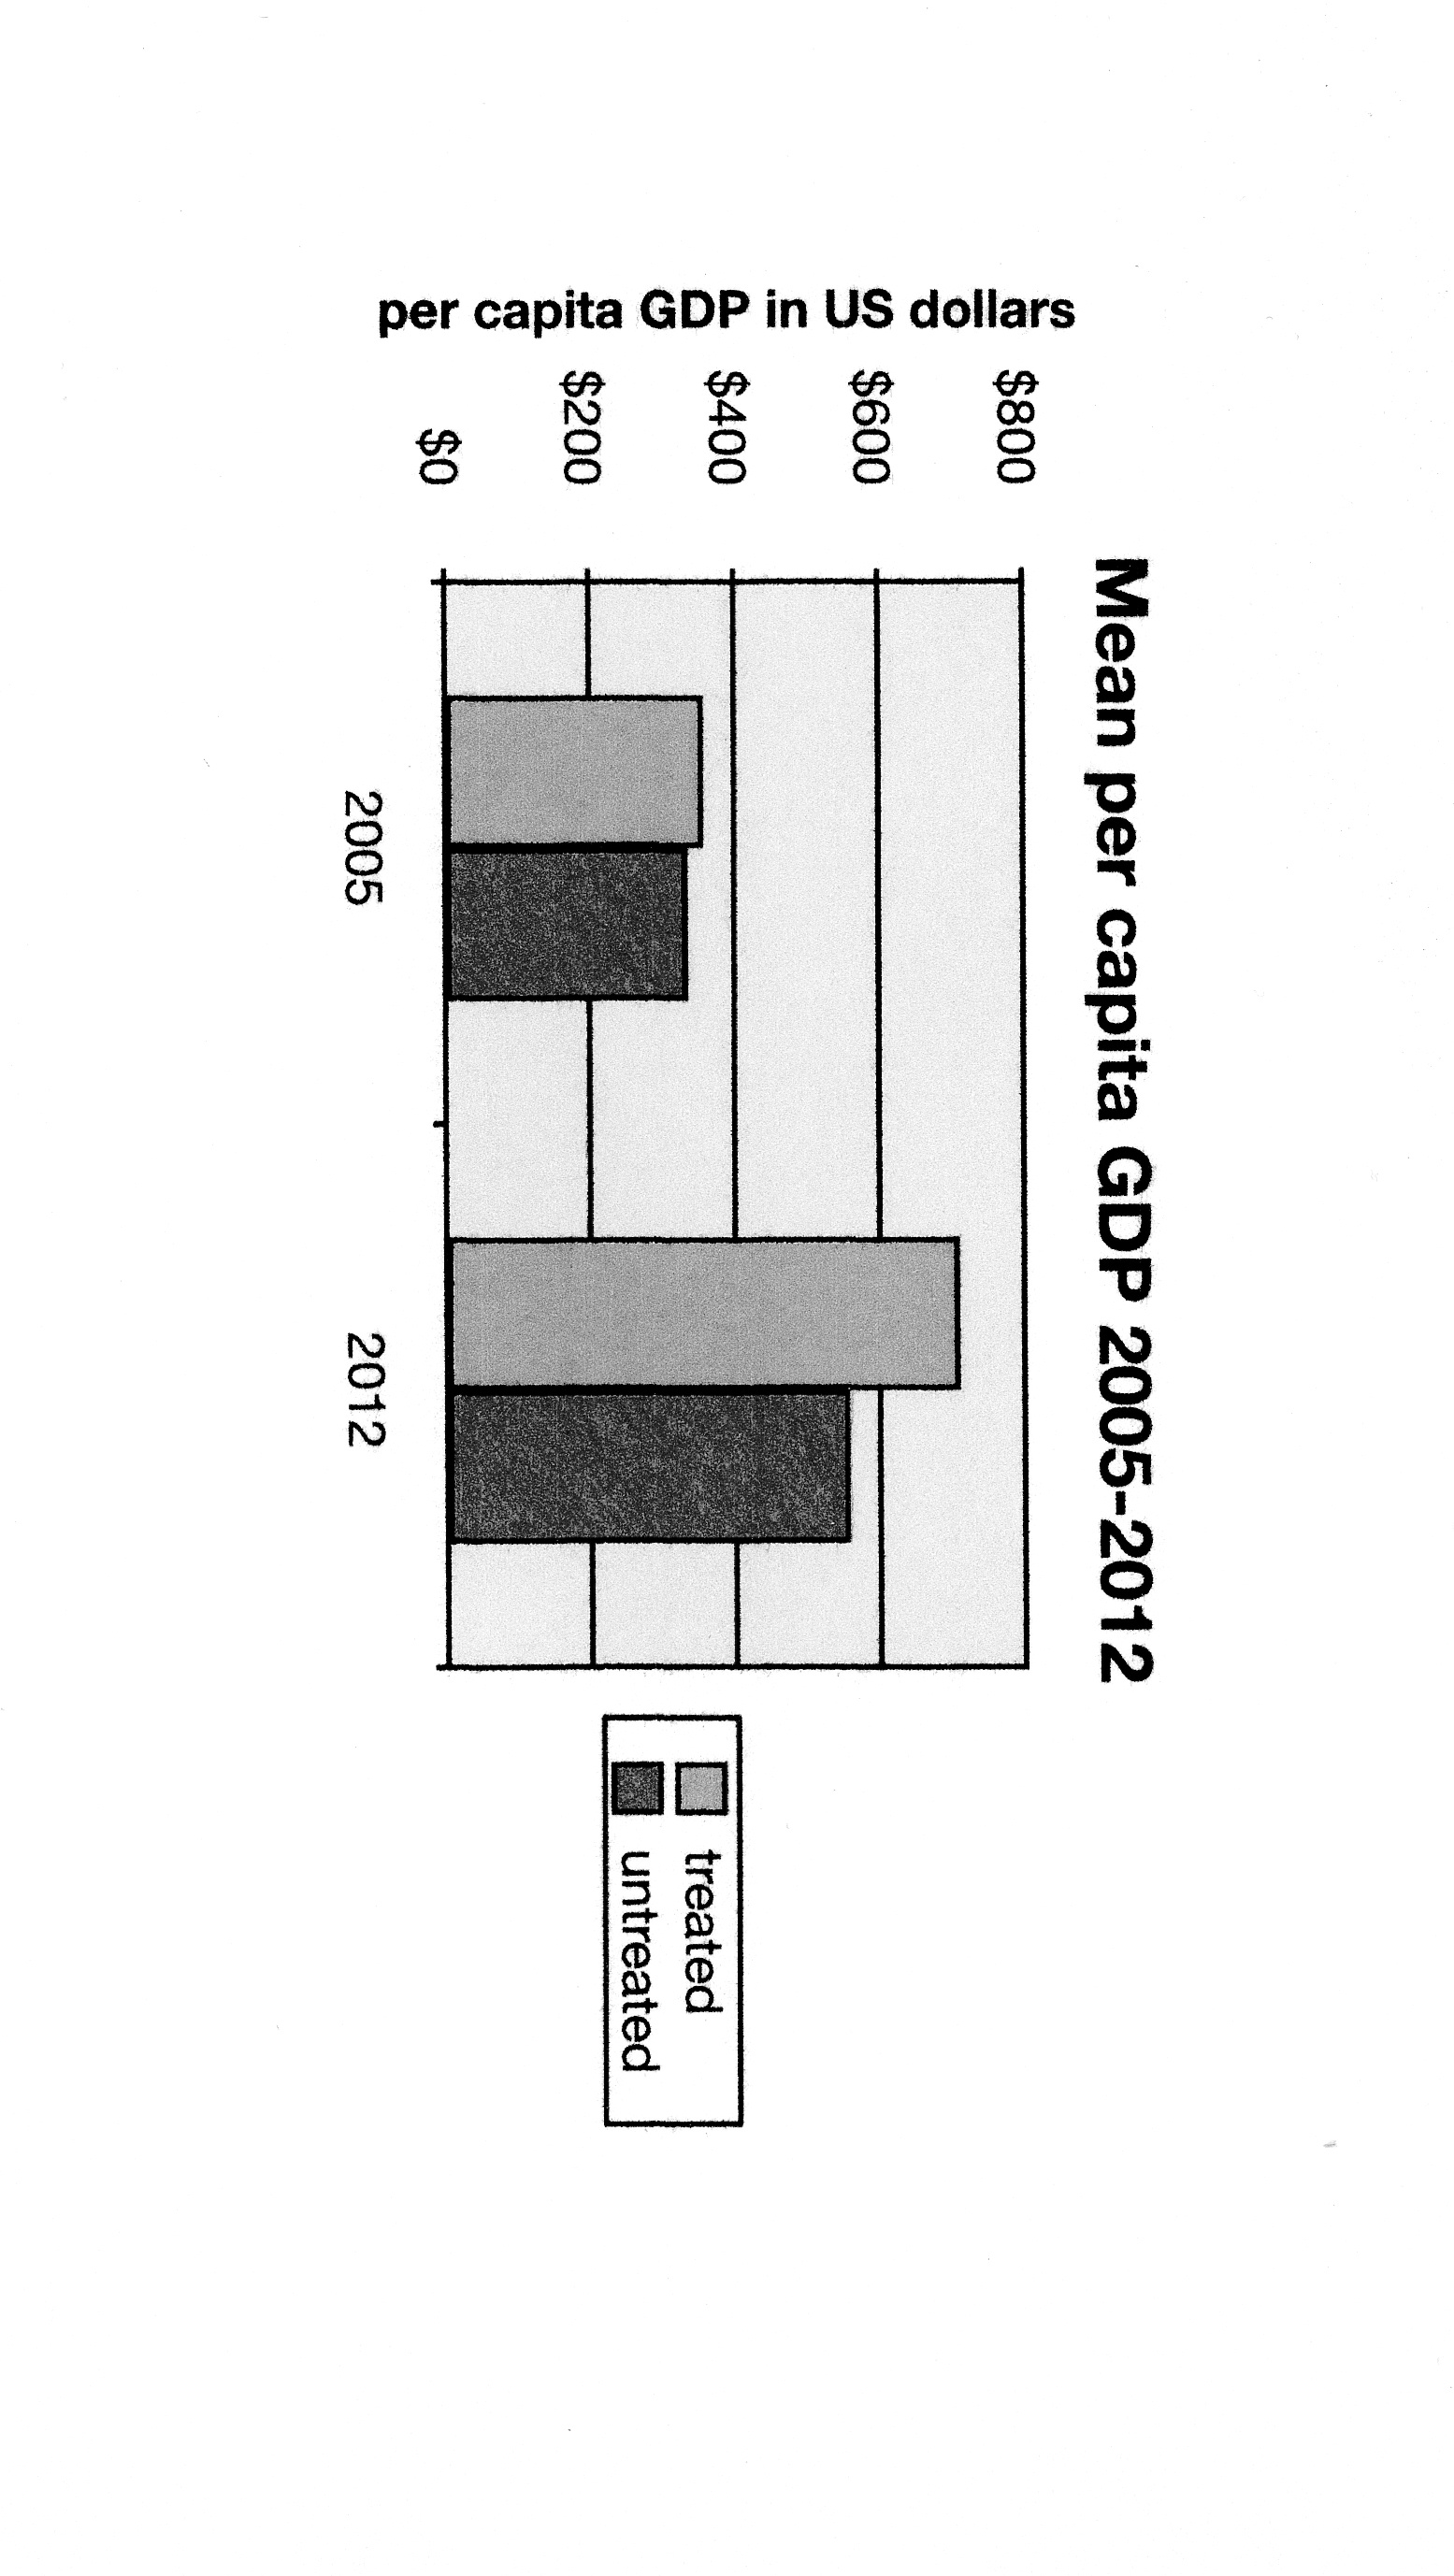
We separated the 54 African countries into a treated group and an untreated group, selecting those which were similar in malaria experience, climate, biology, geography, political history, and economy. The selection process yielded 14 countries for the treated group and 9 countries for the untreated group. Their wide dispersion around the continent and variations in their size made them geographically representative. Additional reason for confidence in their similarity was the nearly identical per capita GDP in both groups in 2005 at the beginning of the Malaria initiative (Fig 2).
Countries were selected for the two groups on the following bases:
Malaria biology and experience. All countries where Plasmodium falciparum was the primary pathogen and where the mosquitoes Anopheles gambiae and Anopheles arabiensis were the primary vectors of malaria were included, giving them similar epidemiology. For the treated group, all countries which had been under malaria suppression by the Malaria Initiative since 2005 were included. Countries which had already suppressed malaria without assistance from the Malaria Initiative were not included, nor were those countries included where activities of the Malaria Initiative started after 2005.
Climate. All countries in the heart of Africa were included, but countries with cold winters were eliminated, namely the countries at the northern and southern extremes of the continent, as well as Lesotho because of its unusually high elevations.
Geography. Countries on the mainland of the continent were included in the two groups, but island countries were eliminated because their extra protection from reinvasion by infected mosquitoes and persons makes malaria elimination relatively easy.
Recent history. Countries with at least 5 years of peaceful political history were included. Thus all countries wracked by warfare during the previous 5 years were eliminated from the two groups.
Economy. Countries with economies based primarily on subsistence agriculture were selected for the two groups. As confirmation of the success in this economic grouping, the two groups had very similar per capita GDPs in 2005 at the beginning of the comparison. The values were $361 for the treated group and $336 for the untreated group (Tables 1 and 2, and Fig 2).
We then collected GDP and population data for 2005 and 2012, covering the seven-year period after the Malaria Initiative began. (Tables 1 and 2).
Results
The gross expenditure reported by the Malaria Initiative was reduced by 14/19 in our calculations because only 14 of the total 19 countries were included in our final GDP analysis. Thus the amount calculated for malaria suppression from 2005 to 2012 in the 14 selected countries was about $0.2 billion annually to protect about 300 million people, an annual expenditure of $0.66 per capita.
Both groups had similar mean per capita GDPs in 2005, before the Malaria Initiative began. However by 2012 the mean per capita GDP in the 14 treated countries nearly doubled, rising from $361 to $714, an increase of $353 or 98%. The increase in mean per capita GDP in the untreated countries was smaller, rising from $336 to $557, an increase of $221 or 66%. The larger increase in the treated countries gave good justification for the funds spent on suppressing malaria.
Without correcting for population changes, the difference in the increase in total GDP between the two groups of countries was $153 billion minus $20 billion, a huge return of $133 billion on an expenditure of only $1.4 billion in these 14 countries, a ratio of almost 100:1 (Tables 1 and 2).
The increase in mean per capita GDP above that of untreated countries in the 7-year period could also be viewed as the difference of $353 – $224, or as an increase of $129. This exceeded recent estimates of a $30 increase if malaria were eliminated from Africa (Moyer and Ende 2012). It should also be noted that their theoretical calculations assumed complete suppression of malaria, while in the countries actually receiving funds from the Malaria Initiative, only partial suppression was achieved. Thus an even greater increase should be expected if the suppression effort were increased.
An important advantage derived from stimulating the economy by reducing disability and death from malaria is that it raises the income of laboring people directly, as opposed to investments in large infrastructure projects which might benefit elite groups but leave the income of the average worker untouched.
Unfortunately the current strategy of the Malaria Initiative and WHO – which depends on biocides, bednets and drugs – might not last much longer because of the increasing development of resistance of the mosquitoes to insecticides and the occurrence of resistance in the malaria parasite to current drugs (Kabula 2013, Mboera et al 2013). After a successful beginning, a similar Global Malaria Eradication Program in the 1960’s had collapsed about 10 years after its start, because of these widespread resistance problems. The current Malaria Initiative is already 8 years old.
Because of the looming specter of chemical and drug resistance, intensive and careful evaluation of the Malaria Initiative is very important for guiding its African strategy. Also African ministries of health should increase their own budgets for malaria suppression and for monitoring progress; based on reasons of economy as well as health.
Summary
The recent economic benefits from suppressing malaria in Africa were remarkably high; orders of magnitude higher than previously estimated. Besides the obvious public health benefits, our analyses showed that this intervention was worthwhile financially – at least as long as the current strategy using ephemeral methods continues to be effective. The Malaria Initiative invested about $0.66 per capita annually in the treated countries for 7 years, and resulted in an increased annual per capita GDP of $353, compared to an increased annual per capita GDP of only $221 over the 7 years in the untreated countries. Thus suppression of malaria in Africa is a remarkably sound investment; it is important that it continue.
References
- Jobin W. 2010. A realistic strategy for fighting malaria in Africa. Massachusetts and Colorado: Boston Harbor Publishers.
- Orem JN, Kirigia JM, Azairwe R, Kasirye I, Walker O. 2012. “Impact of malaria morbidity on gross domestic product in Uganda”, International Archives Medicine. 5(1); 12-30.
- Obeng LE. 1997. Parasites, the sly and sneaky enemies inside you, London: Goldsear.
- Diop M, Jobin W. 1986. Master Health Plan Study for OMVS(Senegal River), WASH/EHP Report No 45, USAID, Washington DC.
- Gaddal A. 1988. “The Blue Nile Health Project in Sudan.” J Tropical Medicine Hygiene 68(2) :47-52.
- Jobin W. 2012. Improving the US Presidential Malaria Initiative. Massachusetts and Colorado: Boston Harbor Publishers.
- Sledge D, Mohler G. 2013. “Eliminating malaria in the American South: An analysis of the decline in malaria in 1930s Alabama.” American J Public Health 103(8):1381-1392. doi: 10.2105/AJPH.2012.301065.
- Somandjinga M, Lluberas M, Jobin W. 2009. “Difficulties in organizing first indoor spray programme against malaria in Angola under the President’s Malaria Initiative.” Bull WHO 87: 871-874.
- USAID website for Annual Reports of Presidential Malaria Initiative 2005-2013.
http://pmi.gov/resources/reports/pmi_annual_report13.pdf. As of 4 January 2014.
- World Bankwebsite – Data Sources on GDP in current US$
http://data.worldbank.org/indicator/NY.GDP.PCAP.CD. As of 4 January 2014.
- Martin G, Grant A, D’Agostino M. 2012 “Global health funding and economic development.” Global Health 8(8): 1-4.
- Purdy M, Robinson M, Wie K and Rublin D. 2013 “The economic case for combating malaria.” American J Tropical Medicine Hygiene 89(50):819-821. doi 10.4269/ajtmh.12-0689.
- Sicuri E, Vieta A, Lindner L, Constenia D, Sauboin C. 2013 “The economic costs of malaria in children in three sub-Saharan countries: Ghana, Tanzania and Kenya.” Malaria J 12910:307. doi: 10.1186/1475-2875-12-307.
- Onwujekwe O, Uguru N, Etiaba E, Chikezie I, Uzochukwu B, Adiagba A. 2013 “The economic burden of malaria in househoulds and the health system in Enugu State southeast Nigera,” PloS One 8(110). doi: 10.1371/journal .pone.0078362.
- Hong SC. 2013 “Malaria: an early indicator of later disease and work level.” J Health Economics 32(3): 612-632. doi: 10.1016/jhealeco.2013.03.004.
- Gallup JL, Sachs JD. 2001 “The economic burden of malaria.”American J Tropical Medicine Hygiene 64(1-2 Suppl):85-96 Review.
- Masiye F, Rehnberg C. 2005 “The economic value of an improved malaria treatment programme in Zambia.” Malaria J 4(1): 60-69.
- Berthelemy JC, Thuilliez J, Doumbo O, Gaudart J. 2013 “Malaria and protective behaviors: is there a malaria trap?” Malaria J 12:200. doi: 10.1186/1475-2875-12-200.
- Tusting LS, Willey B, Lucas H, Thompson J, Kafy HT, Smith R, Lindsay SW. 2013 “Socioeconomic development as an intervention against malaria: a systematic review and meta-analysis.” Lancet 382(9896):963-972. doi: 10.1016/S0140-6736(13)60851-X.
- Index Mundi website for Africa, population records 2005-2012. http://www.indexmundi.com/africa.html. As of 4 January 2014.
- Moyer J, Ende G. 2012 Malaria no more, Futures brief 5. Pardee Center of Denver University.
- Kabula B, Tungu P, Malima R, Rowland M, Minia J., Wililo R, Ramsan M, McElro PD, Kfuko J, Kulkami M, Protopopoff N, Magesa S, Mosha R, Kisiza W. 2013 “Distribution and spread of pyrethroid and DDT resistance among Anopheles gambia complex in Tanzania.” Medical and Veterinary Entomology: Nov 5, doi:10.1111/mve.12306
- Mboera LEG, Mazigo HD, Rumisha SF, Kramer RA. 2013 “Towards malaria elimination and its implications for vector control, disease management and livelihoods in Tanzania.” Malaria World J 4(19).
- Thiam S, Kimotho V, Guema T, Carter J. 2013 “Ball back in Africa’s court: funding malaria control and elimination.” Pan African Medical J 14:78. doi 10.11604/pamj,2013.14.78.2417
Table 1. Increases in economic productivity and populations of 14 African countries in the Malaria Initiative after intervention, from 2005 to 2012.
|
2005 |
2005 |
2012 |
2012 | |
|
population |
GDP |
population |
GDP | |
|
In millions |
billion US $ |
In millions |
billion US $ | |
|
Benin |
8 |
$ 4.4 |
10 |
$7.56 |
|
Ethiopia |
73 |
$ 12.3 |
84 |
$43.13 |
|
Ghana |
21 |
$ 10.7 |
25 |
$40.71 |
|
Kenya |
34 |
$ 18.7 |
44 |
$37.34 |
|
Liberia |
4 |
$ 0.5 |
4 |
$1.77 |
|
Madagascar |
18 |
$ 5.0 |
22 |
$9.98 |
|
Malawi |
12 |
$ 2.8 |
16 |
$4.26 |
|
Mali |
12 |
$ 5.3 |
16 |
$10.31 |
|
Mozambique |
19 |
$ 6.6 |
24 |
$14.59 |
|
Rwanda |
8 |
$ 2.6 |
12 |
$7.10 |
|
Senegal |
11 |
$ 8.7 |
13 |
$14.16 |
|
Tanzania |
37 |
$ 14.1 |
48 |
$28.25 |
|
Uganda |
27 |
$ 9.0 |
34 |
$19.88 |
|
Zambia |
11 |
$ 5.8 |
14 |
$20.68 |
|
Sum for 14 treated countries |
296 |
$107 |
364 |
$ 260 |
|
Mean GDP/cap |
$361 |
$714 | ||
|
Increase in mean GDP/cap |
$353 |
Table 2. Increases in economic productivity of 9 African countries not in the Malaria Initiative, 2005-2012.
|
2005 |
2005 |
2012 |
2012 | |
|
population |
GDP |
population |
GDP | |
|
In millions |
billion US$ |
In millions |
billion US$ | |
|
Burkina Faso |
14 |
$5.5 |
12 |
$10.44 |
|
Burundi |
6 |
$1.1 |
11 |
$2.47 |
|
Eritrea |
5 |
$1.1 |
6 |
$3.09 |
|
Gambia |
2 |
$0.60 |
2 |
$0.92 |
|
Guinea-Conakry |
9 |
$2.90 |
11 |
$6.77 |
|
Guinea-Bissau |
1 |
$0.60 |
2 |
$0.90 |
|
Mauritania |
3 |
$2.20 |
3 |
$4.20 |
|
Niger |
12 |
$3.40 |
16 |
$6.57 |
|
Togo |
6 |
$2.10 |
7 |
$3.81 |
|
Sum for 9 untreated countries |
58 |
$19.5 |
70 |
$ 39 |
|
Mean GDP/cap |
$336 |
$557 | ||
|
Increase in mean GDP/cap |
$221
|
Figure 1. African countries where US Presidential Malaria Initiative was operating in 2012
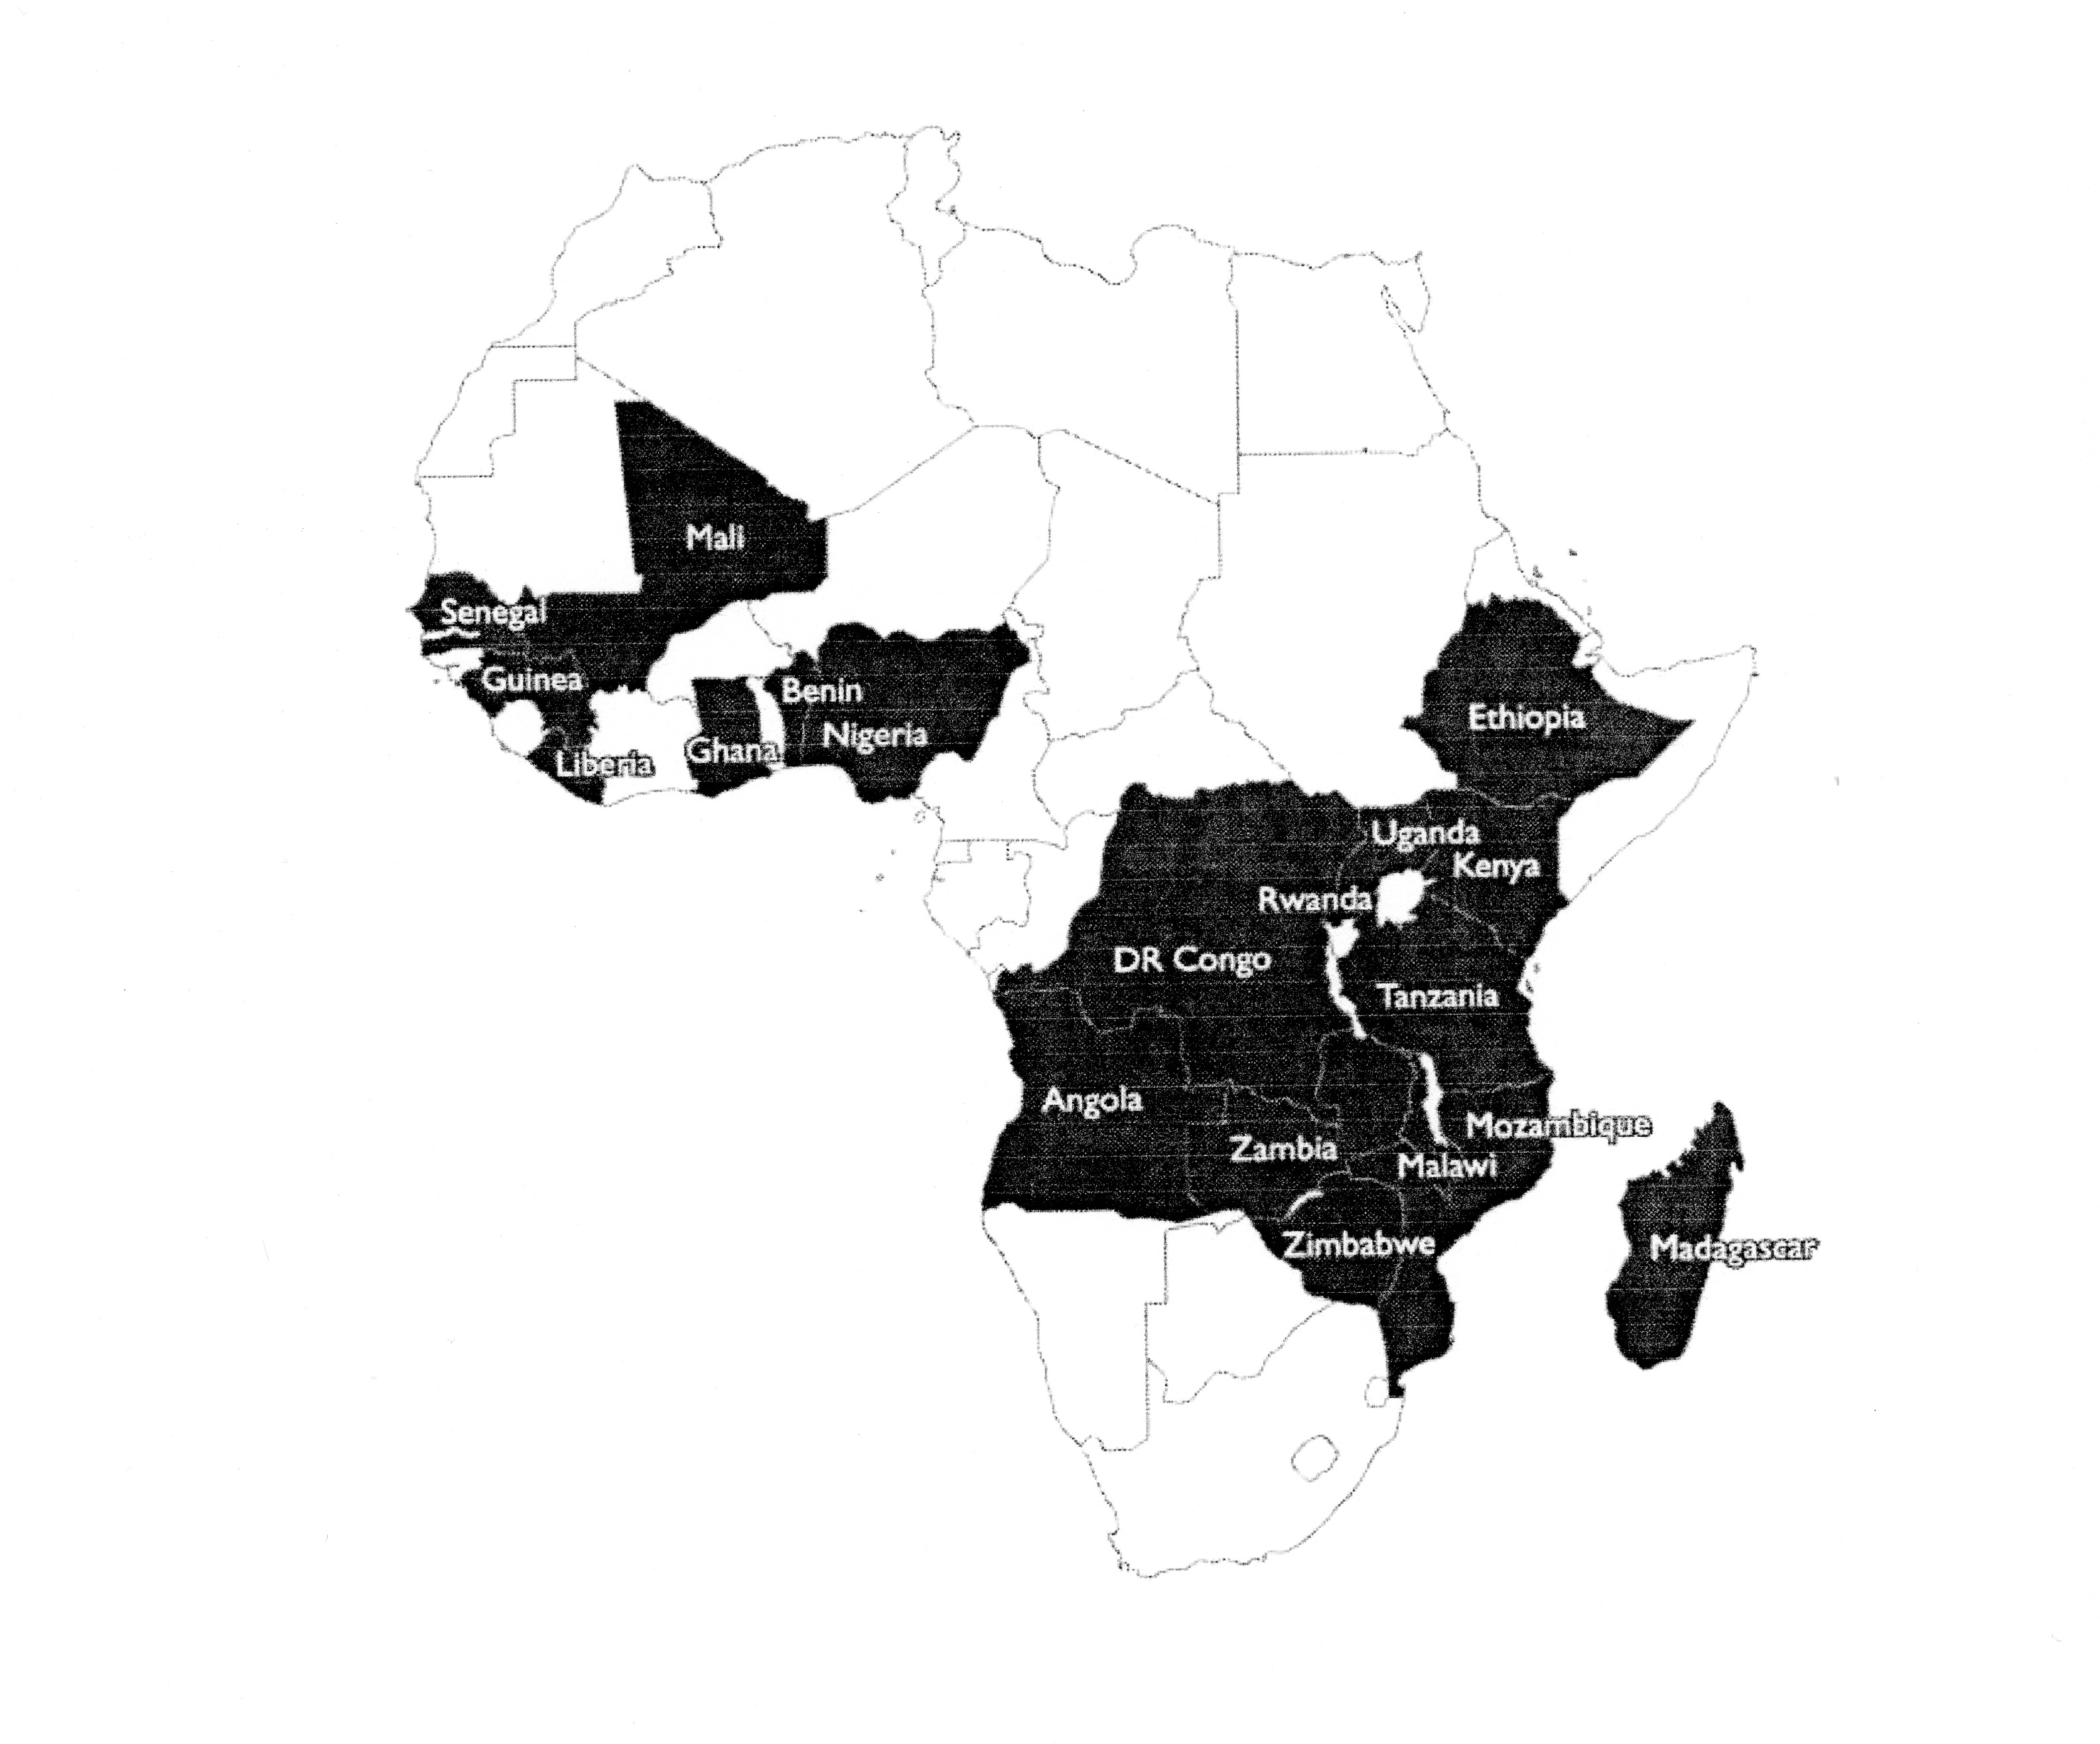
Fig. 2. Comparison of mean per capita Gross Domestic Product in 14 African countries treated under the Malaria Initiative versus 9 untreated countries, for the 7-year period after intervention began, from 2005 to 2012.